Anni Karppinen | October 25, 2016
Developing a new kind of material is fascinating work and requires many innovations before the product is available for the market. One important part of the development work is to find analysis methods t for characterizing the quality. Those methods should ideally describe the material well but also be reproducible and reliable. Often this is ensured by using standard methods, but for new materials, like microfibrillated cellulose (MFC), they do not exist yet. Even though some work has been initiated by Canadian Standards Association (Z5100-14 Cellulosic nanomaterials – Test methods for characterization) and TAPPI, there are no proper guidelines for analysis of MFC yet. As a guidance to those unfamiliar with microfibrillated cellulose, I will share my tips for a reliable, reproducible analysis of MFC.
Sample preparation and history effect
Microfibrillated cellulose consists of fibers in constant interaction with each other in a three-dimensional network. The most prominent properties – like high viscosity at rest, shear thinning behavior, water holding capacity – are a result of this network. It is flexible and changing depending on the environment, which means that also the properties of MFC are dependent on the environment and the history of the sample. This is illustrated in Table 1 which shows the viscosity of the MFC after dilution from 12% to 2% dry content mixed with different mixers and varying mixing time. The viscosity is dependent on both the type of the mixer and mixing time. In addition to the mixing, also the time between the mixing and measurement play a role in the results. This means that the analysis routines should include steps that ensure similar conditions and history for all samples, for instance, exact mixing and rest periods. Keep in mind that factors like pH and salinity also affect the properties of MFC and should be held constant in the measurements. I cover the effect of pH on the MFC viscosity in this blog post
|
|
Viscosity (cP) |
||
|
Time of stirring (min) |
Ultra Turrax |
Dispermat |
Propeller mixer |
|
4 |
25 000 |
- |
- |
|
10 |
- |
25000 |
18000 |
|
20 |
- |
25000 |
21000 |
|
30 |
- |
26000 |
24000 |
Table 1. Viscosity of 2% MFC suspension after dilution from 12% to 2% dry content. Samples are either mixed with Ultra Turrax homogenizer, Dispermat Dissolver or propeller stirrer with varying time. The viscosity was measured with Brookfield viscometer using V-73 spindle at 10 rpm for 5 min
Heterogeneous, natural material
MFC is made from a natural raw material which has more varying properties than synthetic materials. This makes MFC more inhomogeneous than well-defined synthetic materials. The coarser MFC we describe, the more inhomogeneous it probably is. Therefore, sufficiently large sample size and a sufficient number of parallels should be used to distinguish significantly different results from the results that are within the variations in the material or analysis method.
Material with wide scale of dimensions
What are the dimensions of the MFC fibers and fibrils? This is a common question but not an easy one to answer. MFC is made by disintegrating big fibers to smaller and smaller fibrils, sometimes all the way to elemental fibrils. If special care is not taken to remove the residual fibers and fragments, it is almost inevitable that we have fibers with very different diameter and length. This is typical of all natural and semi-synthetic materials.
The broad size distribution gives the material its attractive properties. This is also why it is almost impossible to give an average diameter or length of the fibers: Some of the fibers are visible in an optical microscope, and some need an electron microscope to be visible. You can see this in Figure 1 and Figure 2 (also check what Chinga-Carrasco writes about the different size fractions present in nanocellulose materials). Microscope methods can provide valuable information on the morphology of the fibers. It might also be necessary to use indirect methods for evaluating the fibrillation degree, like rheological measurements or transparency of the material (good examples of indirect methods can be found, e.g., in the articles by Naderi et al. (2014) and Kangas et al. (2014)).
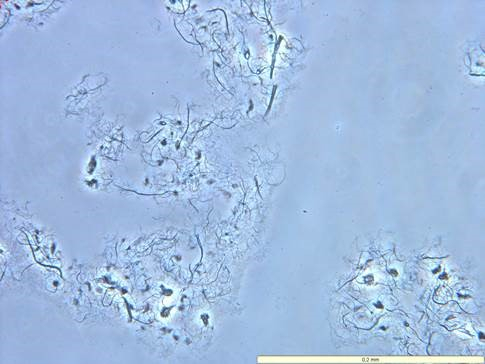 Figure 1. Optical microscope image of MFC suspension (Exilva, Borregaard). Magnification 40 times
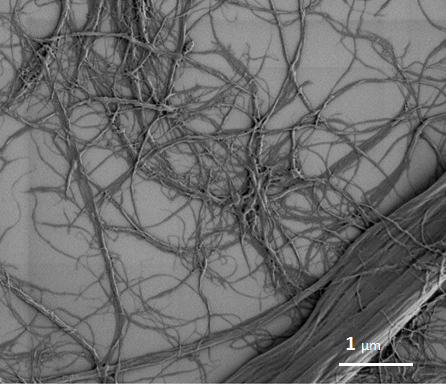 Figure 2. Scanning electron microscope picture of MFC suspension (Exilva, Borregaard)
Changes occurring upon drying
Often, MFC is produced as a fiber suspension in water. If the material is dried afterward, aggregation and changes on the fiber surface will occur (a process called hornification). Consider this when planning the analysis. For example, gas adsorption is widely used for measuring the surface area of small particles. With MFC, this might not be advisable since gas adsorption methods require drying of the material and MFC tends aggregate upon drying. The same might occur when the samples are dried for certain microscopic methods, like transmission electron microscope imaging. On the other hand, if you are going to utilize the film forming or barrier properties of MFC, those can only be tested from dried films (Kulachenko et al. provide a case in point). Hence, before deciding the analysis methods, it is important to consider if you want to examine the material at wet or dry state.
Hint list for testing
Summing up, the following points are vital when analyzing MFC:
- Create routines which ensure similar history for all samples.
- Provide comparable testing environment (e.g. pH, ionic strength).
- Remember that the fibers have a wide size distribution and not all of them are visible with one method. Consider indirect methods.
- Wet or dry material? Choose the analysis methods suited for the properties you are interested in; wet suspension or dried material.
- The coarser MFC, the more inhomogeneous it is. Use sufficient sample sizes and enough parallels.